
Performance guide
Does Razer Synapse Affect Gaming Performance? 6 Checks
Razer Synapse can use CPU and memory while it loads device pages, lighting modules, profiles, and background services. A short startup spike is different from a sustained FPS drop.
Measure the same game scene with one variable changed at a time. This guide helps you decide when to keep Synapse open, close a module, use onboard memory, repair the app, or move to an official reinstall.
Quick answer
When Razer Synapse Can Affect Performance
Yes, Razer Synapse can affect a computer's background CPU and RAM use because it keeps device controls, profiles, Chroma lighting, firmware checks, and app modules available. That does not automatically mean it is reducing game FPS. The useful distinction is whether the load settles after startup and whether the same game scene changes when Synapse or a module is isolated.
A brief increase while Synapse opens, detects a device, or applies a profile is usually a startup event. Treat persistent CPU activity, memory growth, stutter that follows a module, or a repeatable FPS change as a troubleshooting signal. Record the numbers before closing anything so you do not confuse a change in graphics settings, Windows updates, overlays, or network activity with a Synapse effect.
The safest conclusion is conditional: keep Synapse open when you need live lighting, profile switching, macros, audio controls, or device settings; reduce background modules or use documented onboard memory when your device supports it and the application is not needed during the game. Do not delete Razer files or download a third-party performance fix based on one Task Manager snapshot.
What you observe
What it suggests
First action
CPU rises briefly, then settles
Startup or device detection work
Wait for the device page and record a baseline
RAM stays high after a restart
Module loop, stale state, or a device issue
Check App Engine and installed modules before reinstalling
FPS changes only with one overlay or module
A feature or conflict may be involved
Disable one feature and repeat the same scene
No repeatable change in the same scene
Synapse is not proven to be the cause
Keep the working setup and check other variables
What is running
What Synapse and Razer App Engine Do in the Background
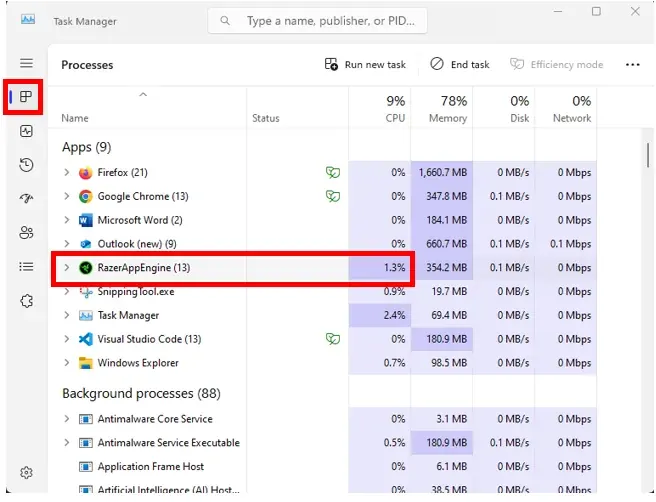
Synapse is more than a single settings window. The current Windows branch can load device modules, profile data, lighting effects, firmware checks, account state, and supporting processes. Razer App Engine is part of that application layer. Seeing it in Task Manager is not proof of malware, and ending it is not a complete repair. The source, file location, startup behavior, and repeatable symptom matter more than the process name alone.
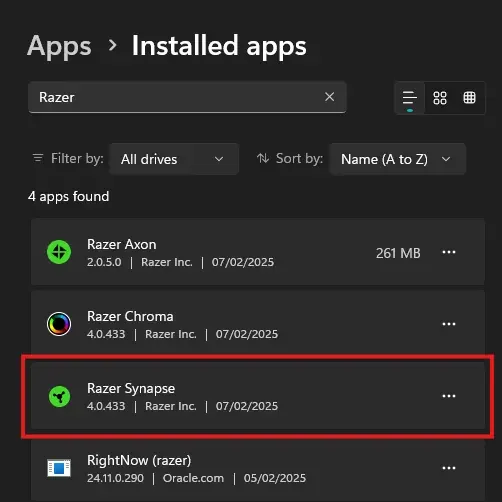
A useful inventory starts in Windows Installed apps. Note whether Synapse, Chroma, Axon, or another Razer component is present, then compare that list with the features you actually use. A lighting module may be relevant for a Chroma setup but unnecessary for a mouse-only workflow. Do not remove a component while a profile, macro, or audio setting is being used without first recording the device and profile state.
This distinction also prevents a common mistake: treating a normal background process as a frame-time measurement. CPU percentage in Task Manager is a system snapshot, while FPS and frame time describe the game workload. Measure both in a repeatable scene and keep Windows pointer speed, game settings, overlays, and power mode unchanged during the comparison.
Measure first
How to Check CPU, RAM, and FPS Without Guessing
Start at the desktop with the game closed. Restart Windows, open Synapse once, wait until the device page and profile finish loading, and write down the Razer processes' CPU and memory values. A cold-start number is useful only when you label it as startup. Then wait two or three minutes and record a settled value. If the number continues climbing, capture the time and the module that was opening when it changed.
Next, use one game scene that you can repeat, such as the same training area or a fixed benchmark. Keep resolution, graphics preset, frame cap, refresh rate, Windows power mode, browser tabs, overlays, and recording software unchanged. Run the scene once with your normal Synapse setup, then repeat after one controlled change. Compare average FPS and frame-time consistency; a single low frame is not enough to identify Synapse as the cause.
Finally, reverse the change. If closing Synapse appears to help, reopen it and disable only the suspected feature or module. If the effect disappears when an overlay, RGB controller, or audio enhancement is removed, the conflict may be between applications rather than Synapse itself. Keep the working configuration documented so a future update can be compared against the same baseline.
Set a baseline
Restart Windows, open Synapse, wait for the device page, and record CPU and RAM after startup settles.
Repeat one scene
Use the same game area, graphics settings, frame cap, power mode, and overlays for every run.
Change one layer
Close Synapse, disable one module, or switch one device feature; do not change all settings together.
Compare frame time
Look for repeatable average FPS or frame-time changes, not one isolated dip.
Reverse the test
Restore the original setup and confirm whether the effect returns before blaming Synapse.
Write down the result
Record the branch, device, profile, module, and test scene so an update can be checked later.
Six checks
Fix Synapse Performance Problems in the Safest Order
1. Restart before repairing. A pending Windows restart, a half-loaded device module, or a previous installer process can make background use look worse than it is. Close the game, restart Windows, and repeat the baseline before deleting anything.
2. Check the active profile and linked application. A profile can trigger lighting, macros, DPI, or audio behavior when a game starts. If the game is launching a different executable than the one linked in Synapse, the apparent performance change may be a profile switch rather than a CPU problem.
3. Test overlays and companion apps. SignalRGB, other RGB controllers, audio suites, capture tools, and vendor overlays can compete for the same device or hook the same game. Disable one competing layer, then repeat the exact scene. Keep a note of which app was changed.
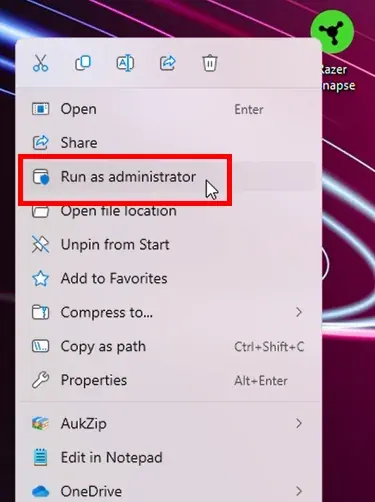
4. Run the official app with a clean device state. Disconnect extra Razer devices only for a controlled test, use the normal USB or receiver path, and check whether the device page loads. If Synapse does not open or a device is missing, use the dedicated repair guide rather than a random performance utility.
5. Check the update branch and module state. A current official release can change device handling, while a stale or incomplete install can leave a component looping. Confirm the release record and use the official repair or reinstall path only after the measurement and device checks.
6. Reinstall last. Save profiles and note your device model first. Use the official Razer source, keep one Synapse branch installed, and repeat the same performance test after the reinstall. A reinstall that changes many variables at once is difficult to diagnose, so keep the original notes.
Order
Change
Why it comes here
1
Restart and measure
Preserves evidence and clears pending startup state
2
Check profile and device
Separates a profile switch from a system load problem
3
Isolate competing apps
RGB, audio, capture, and overlays can share hooks
4
Check official update state
A release or partial install can change behavior
5
Repair or reinstall
It is disruptive and should follow a recorded baseline
Choose a mode
Should You Keep Synapse Open While Gaming?
Keep Synapse open when you need live profile switching, Chroma effects, device remapping, macros, EQ, microphone controls, or a setting that is not stored on the device. In that mode, judge whether the background cost is stable and acceptable on your computer. Closing the process can also remove the feature you are testing, so it is not a neutral comparison.
A close or onboard-memory test is useful when the device supports the setting you need without the app. Save a known-good profile, verify which values the hardware actually stores, and test the game after a restart. Not every lighting, macro, audio, or profile feature moves to onboard memory. If a value changes after Synapse closes, check the device documentation and active profile before assuming the app caused an FPS issue.
The practical decision is the smallest stable setup that keeps the features you use. A mouse-only player may need less background behavior than a full Chroma and headset setup. If the performance difference is not repeatable, keep the working configuration and monitor it after an official update instead of chasing a theoretical percentage.
Current source facts
Current Synapse 4 Version and Download Boundaries
This site is a download guide, so version freshness was checked before publishing this performance page. The Razer Insider release record dated November 5, 2026 lists Synapse for Windows 4.0.86.2610281118 and Chroma for Windows 4.0.63.2610281118. The Razer product page and Synapse 4 support FAQ remain the first-party references for the current Windows branch, compatibility, and repair decisions.
The stable Razer CDN installer was checked on November 7, 2026. It returned HTTP 200, MIME type application/x-msdownload, and Content-Length 14,923,464 bytes. The versionless URL is an official direct file fallback, but this guide does not claim a checksum or a malware scan. Use the product or support page when you need the surrounding release context, and do not replace it with a reuploaded EXE.
If a future release changes background behavior, repeat the same baseline and scene test before comparing results. The page date and source links tell you which release record was used; they do not promise that CPU, RAM, or FPS values will be identical on another device.
Field
Checked result
Use on this page
Current public Windows release
Synapse 4.0.86.2610281118 / Chroma 4.0.63.2610281118
Label the baseline with a date
Release record
Razer Insider, November 5, 2026
Check release notes before comparing behavior
Platform
Windows 11 x86-64 and Windows 10
Confirm the OS and support branch
Installer response
HTTP 200 · application/x-msdownload · 14,923,464 bytes
Official fallback metadata only
Download claim
No checksum or malware-scan claim
Avoid mirrors and invented safety promises
Official references
Razer Sources Checked
First-party product, support, release, and installer sources were checked before writing the performance guidance and version note.
Razer Synapse 4 product page
Current device controls, modules, compatibility, and official Windows route.
Razer Synapse 4 Support & FAQs
First-party installation, device, and troubleshooting context.
November 5, 2026 Synapse and Chroma release record
Official release note listing Synapse 4.0.86.2610281118 and Chroma 4.0.63.2610281118.
Stable Razer Synapse 4 installer
HTTP 200, application/x-msdownload, 14,923,464 bytes at the November 7 check.
FAQ
Razer Synapse Performance FAQ
Does Razer Synapse affect FPS?
It can affect background CPU or frame-time behavior on some setups, but a single FPS dip does not prove causation. Repeat the same scene with one module or overlay changed and compare average FPS and frame time.
Does Razer Synapse use a lot of RAM?
Synapse can use memory while modules, device pages, lighting, and background services are loaded. Record memory after startup settles; persistent growth or a crash deserves troubleshooting rather than an immediate file deletion.
Why does Razer Synapse use CPU while I am gaming?
Profile switching, device polling, lighting, audio, firmware checks, or a competing controller can wake background processes. Check the active module and repeat the game test after isolating one feature.
Should I close Razer Synapse while gaming?
Close it only when your device stores the settings you need or when you are running a controlled comparison. Live profiles, Chroma, macros, and some audio controls depend on the application.
Is Razer App Engine a performance problem?
The process is part of the Synapse application layer and is not automatically a problem. Check whether CPU or memory stays high after startup, whether the app loops, and whether the source and file location are official.
Can a Razer Synapse update change performance?
Yes, an update can change device modules or background behavior. Record the version, repeat the same baseline and game scene, and use the official release note before deciding to repair or reinstall.
Where can I download Razer Synapse safely for a performance test?
Use the official Razer product or support page. The verified versionless CDN fallback returned HTTP 200 and application/x-msdownload on November 7, 2026; this site does not host mirrored installers or claim a checksum.